Breaking down Conti - Malware Analysis
Groups known to utilize the Conti Ransomware
- Wizard Spider
- Financially Motivated
- Creation of Trickbot
- Target MO: Major Corporations, Hospitals
Notable MITRE Mapping
Courtesy of MITRE.org
- T1135 (Network Share Discovery): Conti can enumerate remote open SMB network shares using NetShareEnum()
- T1057 (Process Discovery): Conti can enumerate through all open processes to search for any that have the string “sql” in their process name.
- T1021 (Remote Services: SMB/Windows Admin Shares): Conti can spread via SMB and encrypts files on different hosts, potentially compromising an entire network.
- T1016 (System Network Configuration Discovery): Conti can retrieve the ARP cache from the local system by using the GetIpNetTable() API call and check to ensure IP addresses it connects to are for local, non-Internet, systems.
Unique Characteristics of Conti
VMWare’s TAU (Threat Analysis Unit) has published a technical writeup (https://blogs.vmware.com/security/2020/07/tau-threat-discovery-conti-ransomware.html) on Conti, so I’ll present the characteristics of this ransomware in bullet form for easy digestion:
- 32 individual and independent process threads that allow for much faster encryption over other ransomwares.
- Support for commandline allowing for direct control by adversaries – allows for skipping of local files and going straight for network SMB shares.
- Utilization of the Windows Restart Manager to ensure all files are properly encrypted – this service allows the malware to kill a service that may be locking a file from being modified.
Technical Analysis
Static Analysis
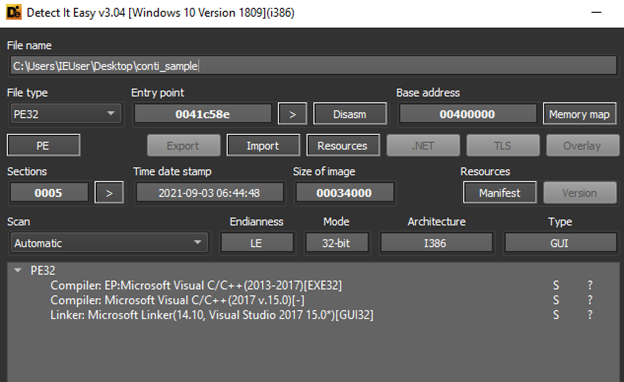
Utilizing Detect It Easy, we can quickly gather useful information from a sample – including binary entry points, architecture, compilation information, section names, and string data.
We can also leverage the entropy functionality to view offsets and sizes for all embedded sections:

Hardcoded Strings
Every compiled program includes hardcoded strings that are viewable in plaintext. This can be accomplished through tools like DIE, PE-Studio, PEBear, or even through the Linux command strings. Regardless of the method, we can obtain essential information about a program’s functionality, how it was compiled, and potentially identifiable information of an adversary if poor OPSEC was used. We can also potentially see function names of all imported DLLs that may give insight into techniques utilized such as checking for debuggers or looking for virtualized hardware (sandboxing):
![]()
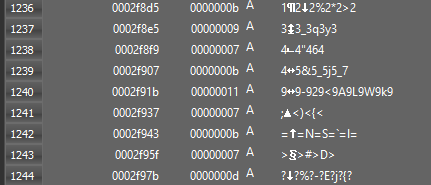
However, in sophisticated malware with good obfuscation design, we will often mostly just see junk that is not representable in ASCII (e.g. embedded shellcode). Below is a screenshot showing that not every string in a binary sample will be useful for static analysis. This type of representation is not necessarily malicious, but often just binary data that can’t be represented in ASCII.
Libraries and Functions
Utilizing another tool like PESTUDIO, we can quickly gather all imported libraries (DLL) and see the functions that our sample utilizes:

PESTUDIO will also mark functions that are often seen in malware samples
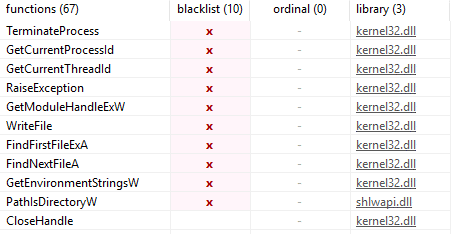
All this information alone does not constitute evidence of a malicious binary. However, the more indicators we are able to extrapolate during this process, the higher confidence we can have of a sample’s disposition. It’s important to note that these are all legitimate functions that do have real-world use and should not be implicitly interpreted as bad without additional context. One funny thing about this particular sample, is PESTUDIO being able to show us the original file name:
![]()
API Calls and their purpose within the scope of malware
Often during analysis, you’ll start to recognize that malware leverages the same API calls imported from Kernel32. In this section I will detail a few API calls that should raise eyebrows when seen in conjunction and that can be found within this Conti sample:
- Persistence
- WriteFile
- Anti-Analysis/Anti-VM
- IsDebuggerPresent
- IsProcessorFeaturePresent
- GetOEMCP
- GetCPInfo
- CreateFileW (Checks if a file exists)
- Execution
- CreateThread
- GetProcAddress (Import Library)
- LoadLibraryExW (Load a library from memory)
- TerminateProcess
- Allows encryptor to access files locked by some other process.
Function Exports
This Conti sample (compiled 9/2021) also has several exports:
- DllInstall
- DllRegisterServer
- EntryPoint
Dynamic Analysis
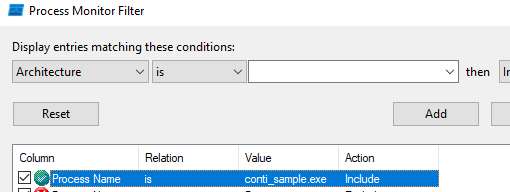
For dynamic analysis, we are going to leverage two tools: Process Monitor (Procmon by SysInternals) and x32dbg (Since this is a 32-bit PE per our static analysis findings). The first thing we’ll want to do in order to limit the scope of data we’re looking at is create a filter within procmon for our binary’s name:
Debugging in x32dbg
The next thing we’ll do, is open the sample with x32dbg (in elevated mode). We can step into/over the program instructions, and eventually we’ll hit a critical function call – the Anti-Debugging/Anti-VM checks:

Let’s see what happens to the program once we resolve this function call. Eventually, we’ll jump to an interesting memory location:
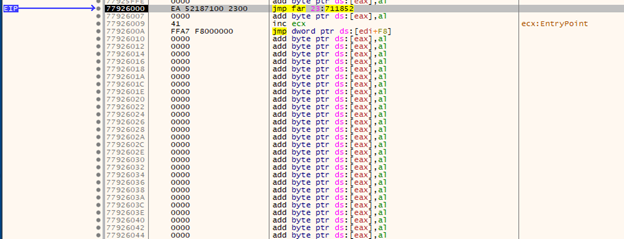
Which then sends us to a function call for “pushad” which essentially just stores all the active registers onto the stack.

pushad often precedes shell-code in trojanized applications, as we want to be able to return to a legitimate program flow after execution and to do that we need to record the state of the program’s memory onto the stack so we can return to it, as the registers in use will likely be overwritten by shellcode function values. That’s not necessarily the case in this application, just thought it was a good point to interject that information. So after this, the binary determines if it’s running in a debugger and will create an infinite loop to halt any further execution:

If we look carefully, we can see that we’ll never be able to reach this memory location:

Why is this important? The program’s flow is locked behind encrypted function calls, which are only decrypted during runtime. This prevents us from fully understanding the program’s flow within a debugger.
Debugging Symbols
One useful part of dynamic analysis is extrapolation of debugging symbols during runtime. If we remember back to our initial static analysis, we only saw function imports coming from three DLLs:
- Kernel32
- Shlwapi
- User32
But what’s missing here? Well if this is ransomware, we’d expect to see some utilization of encryption libraries.

Libraries of note here:
- NTDLL
- This is where we’ll find things like NtVirtualAlloc, NtVirtualProtect, etc, which are often used during DLL injection or process hollowing.
- Cryptbase & bcryptprimitives
- Crypto libraries
- Gdi32
- Often leveraged for UAC bypass through vulnerable COM objects
Gathering Telemetry with Procmon + Process Hacker
At the risk of seeming like I am shamelessly plugging Procmon and SysInternals… let me tell you just how awesome this piece of software is from an information gathering standpoint. What kind of information can we gather? Registry actions, File I/O, Network Activity, Process activity (thread creation, including stack information per thread). We can also validate all the DLLs loaded by the PE file during runtime to validate our hypothesis that the Crypto libraries and malicious thread creations are not revealed until runtime. Before we kick off the PE sample, please take extra caution here – If you’re working on a guest VM, make absolutely sure there is no way this sample can interact with the host (disable network adapters, disable shared folders, everything). Once you’ve done all that, double check it and triple check it. Feeling safe? Let’s run it now. Within process hacker, we can actually see handles to files being opened and closed live (red = recently closed, green = recently opened):
![]()
But what we really want to take a look at is the information being stored on the stack during run-time which we can do in Process Hacker. For example, take a look at this:
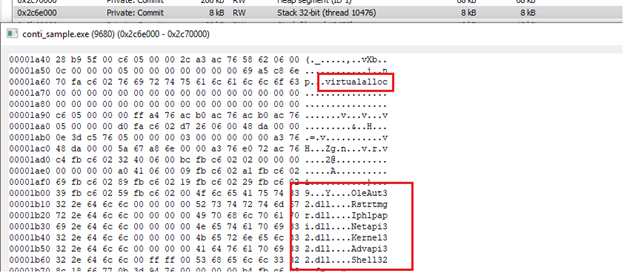
Here we can see some interesting DLLs being referenced that we didn’t see during static analysis such as importing the Restart Manager, which would allow this binary to have functionality to kill processes and services that may be “locking” files out from the encryptor – so it kills the service and is then able to rewrite the file. We also see references to our favorite function, VirtualAlloc – which would have raised some eyebrows during static analysis. We can also see the Conti sample engaging in registry activity that falls in line with leveraging built-in crypto functionality (AES/RSA):
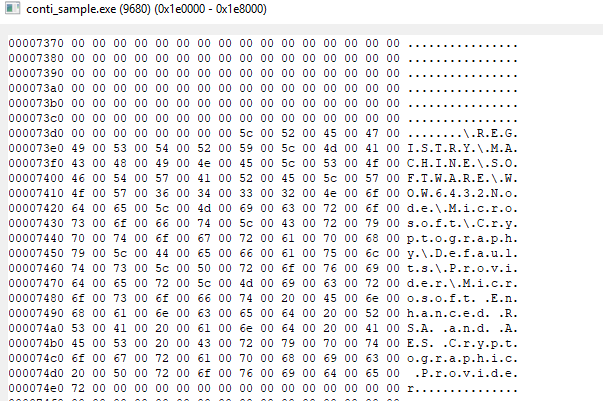
Now these things are not meant to be an all-inclusive list or even really even going below the surface of what we can examine, just some things worth highlighting as we are able to gain more insight into the binary’s functionality. Since we’ve neglected procmon, let’s take a look at some things we can keep an eye on. If you recall, at the start of this writeup, I discussed one of the cool features of Conti ransomware being the usage of multithreading to encrypt files very quickly and here we can see just how many threads this sample made at once on my test machine:
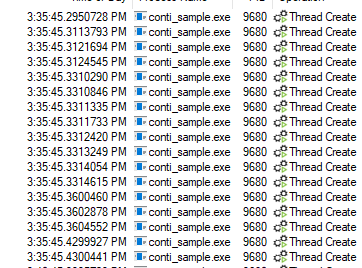
I want to illustrate something important here. To do that, let’s open the top two (first two) threads:

The first thread is tied to the initial process creation – and if you remember, during static analysis we were missing a lot of the imported function calls due to them being loaded/decrypted during runtime. Now comparing the process creation thread to the subsequent thread, we can see module images being loaded into memory. I’m not going to deep dive into each of these, but we can gather some useful data out of this

Notice in how these three distinct threads all reference the same 6 memory locations for memory access, and it’s not tied to any known module. This clues us in that these 6 memory addresses are critical to the ransomware’s functionality, as every new thread references them. Because we know the threads are tied specifically with the encryptor, we can surmise that these memory addresses hold the functionality to engage in that task. Moving away from files, stacks, and threads (oh my!), we’re going to identify some other modules that this ransomware leverages. If you recall, two of the notable MITRE mappings I pointed out at the start were T1021 (Remote Services: SMB/Windows Admin Shares) and T1016 (System Network Configuration Discovery). Interestingly enough, the encryptor doesn’t do this right away but looks like it kicks off network activity once the encryption routine has started on the first host:
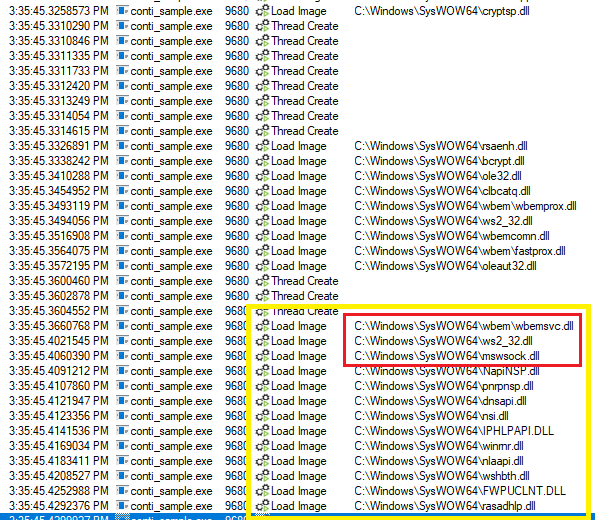
Now the first 3 DLL loads are really all we need to know here (all the highlighted are related to netcon activity but we’re focusing on these three). WBEMSVC is tied to WMI, WS2_32 and MSWSOCK are both utilized to create sockets. We also see some DNS APIs, and Remote Access (rasadhlp.dll) thrown in there. This confirms that the binary utilizes network communication. If you had network connectivity enabled (I highly recommend you don’t unless you have a completely isolated subnet to run this on that has appropriate firewall ruling to drop all traffic), you’d see something like this (notice how many netcons are made in less than a second):

Closing Remarks
I am still very new to malware analysis techniques, and working through this has really helped me to identify weak points in my knowledge and skillset. I hope that other junior/mid-level analysts are able to get something out of this, and be inspired to step out of your comfort zone. Anyone that’s ever worked in a SOC knows how terrifying the prospect of ransomware propagating can be - but hopefully with some basic analysis skills, we can start to identify behaviors instead of IOCs. Scoping ransomware in a network becomes much easier if we’re able to identify the functionality early on (SMB propagation, WMI abuse, UAC bypass, etc.). With some luck, and a little bit of knowledge we may be able to stop a threat actor before the data exfiltration and extortion stage (and leverage those secured backups we’re surely keeping).