Boss of the SOC (BOTS) v3 Walkthroughs
I am always looking for ways to practice and improve proficiency with SIEMs outside of work, but it can be difficult because not all the tools are publicly (and freely) available. However, Splunk not only provides FREE training in the form of Fundamentals courses, but also offers Splunk itself as a free installation (with ~500 MB ingestion limitations - which can be increased significantly with a FREE dev license). I found BOTS through Chris Long’s DetectionLab documentation, and recently got it up and running on my local deployment. This iteration of BOTS (v3) is a few years old, but the SPL skills needed for IR/SOC Analysts is virtually unchanged. The methodology is what we’re practicing, syntax is trivial to learn (i.e. google).
While this writeup is mainly for my own personal benefit, I decided to share it publicly to get feedback on my thought processes, workflow, and SPL chops. Answers are hidden via markdown details, but clicking them will reveal the answer if you get stuck.
Starting Point
As with any new Splunk environment, we should take the time to understand what type of log sources are ingested into this index. To do that, we can run the SPL | metasearch index=botsv3 | stats values(sourcetype) as sourcetypes. This gives us a look at every possible sourcetype in the botsv3 index. It will be useful to have this info at hand readily, so we can export this stats table to a csv for easy reference later.
Question 1
This is a simple question to get you familiar with submitting answers. What is the name of the company that makes the software that you are using for this competition? Answer guidance: A six-letter word with no punctuation.
AWS Questions
Question 2
List out the IAM users that accessed an AWS service (successfully or unsuccessfully) in Frothly’s AWS environment? Answer guidance: Comma separated without spaces, in alphabetical order. (Example: ajackson,mjones,tmiller)
Since we are being told the scope of logging is AWS related, we should look at the Cloudtrail logs via index=botsv3 sourcetype="aws:cloudtrail" to see what fields are parsed in this log source, and what field might have the right information. We can run an index+sourcetype search like this and see the field we need is userIdentity.userName:
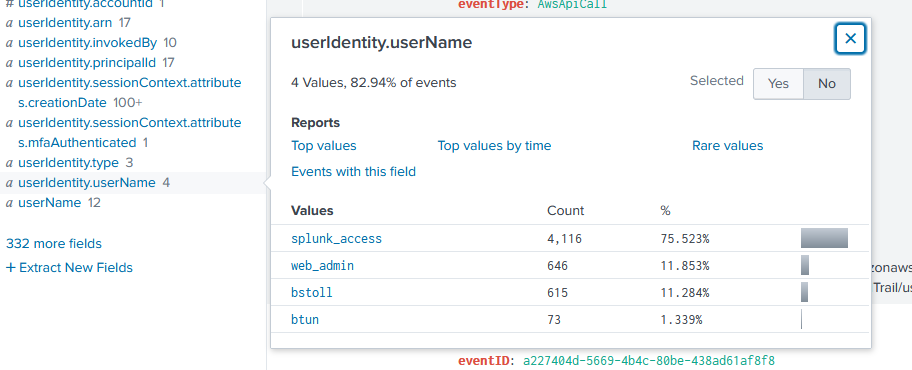
Now all we need to do is list it in alphabetical order. We can craft SPL that returns some useful information (user count, usernames, etc), and then formats it how the question requires like so:

Question 3
What field would you use to alert that AWS API activity have occurred without MFA (multi-factor authentication)? Answer guidance: Provide the full JSON path. (Example: iceCream.flavors.traditional)
If we CTRL+F the payloads, we can quickly find "mfaAuthenticated": "false"
![]()
however, this is not the actual field name value. By expanding the payload syntax highlighting, we can see that the correct field name is here:

Question 4
What is the processor number used on the web servers? Answer guidance: Include any special characters/punctuation. (Example: The processor number for Intel Core i7-8650U is i7-8650U.)
For this question, I’m not really sure what log sources in this dataset will reference hardware information. But we can run a keyword search for “Intel” and/or “AMD” and see if any sourcetypes return via the SPL index=botsv3 ("intel" OR "amd") | stats values(sourcetype) as sourcetypes. We get a couple back, but there are a few standouts.
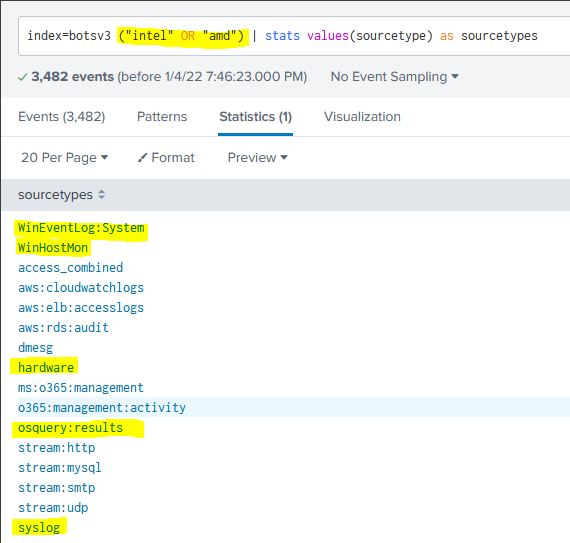
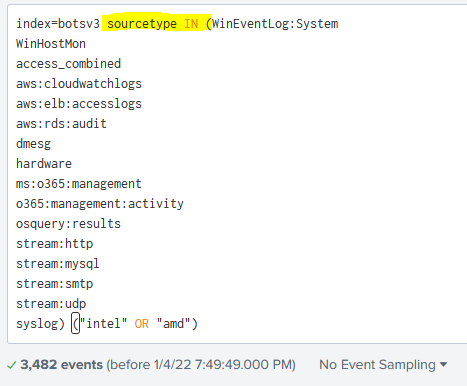
However, I don’t want to have to keep going back and forth, so we can just select all the sourcetypes and use the IN keyword to look at all the sourcetypes at once for these keywords:
There’s a little trick we can do here do see if any of these logs specifically reference CPU information (Intel and AMD both manufacture more than just CPUs). By clicking on All Fields in the field column:
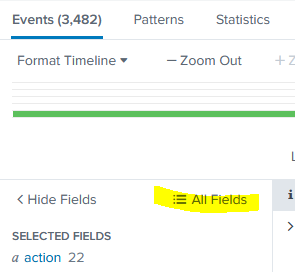
We can then filter on names that contain “CPU”:
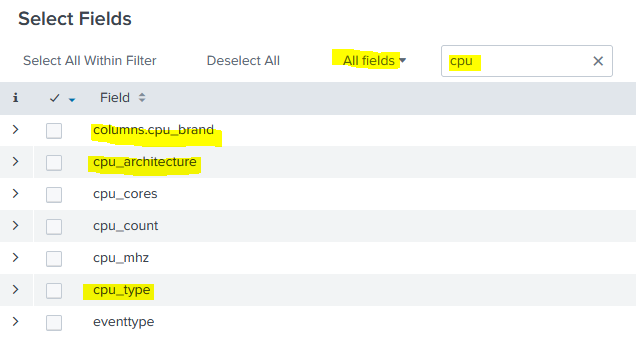
Then when we go back to our Event results, we can drill down into one of these fields and see that we get processor information back:
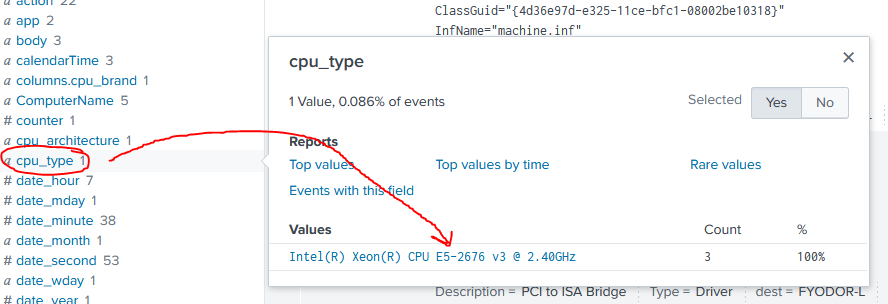
Question 5
Bud accidentally makes an S3 bucket publicly accessible. What is the event ID of the API call that enabled public access? Answer guidance: Include any special characters/punctuation.
Back to AWS logs! Cloud Buckets being assigned public IPs or having their ACLs modified is definitely a relevant point of investigation in today’s network infrastructure that heavily relies on cloud services. The first step here is figuring out who “Bud” is and what his username might be in AWS. By running a metasearch for the term “bud” (| metasearch index=botsv3 TERM(bud) | stats values(sourcetype) as sourcetypes) we get back a few sourcetypes but there are two great standouts:
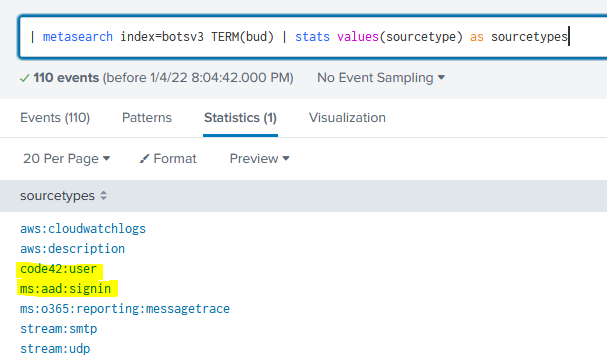
Code42 is an American cybersecurity software company based in Minneapolis specializing in insider risk management. It’s great that this simulated organization is using an Insider Threat platform, and the user data logged will be essential to understanding who this person is. If we remember back to Question 2, we can see that one of the AWS usernames we found was bstoll. We’ll now pivot to that user’s activity via AWS CloudTrail logs (CloudTrail audits all API calls) by using the SPL index=botsv3 sourcetype="aws:cloudtrail" userIdentity.userName=bstoll. (remember the username field was also a part of solving an earlier question)
AWS CloudTrail logs are very verbose, and give us a TON of useful information. Running that SPL gave us 615 logs, and on a live production environment we might get thousands of logs back for a single user. To narrow it down, we’ll use some of the CloudTrail log fields. First, we’ll start by looking at the eventtype field and here we can see aws_cloudtrail_notable_network_events as a field value:
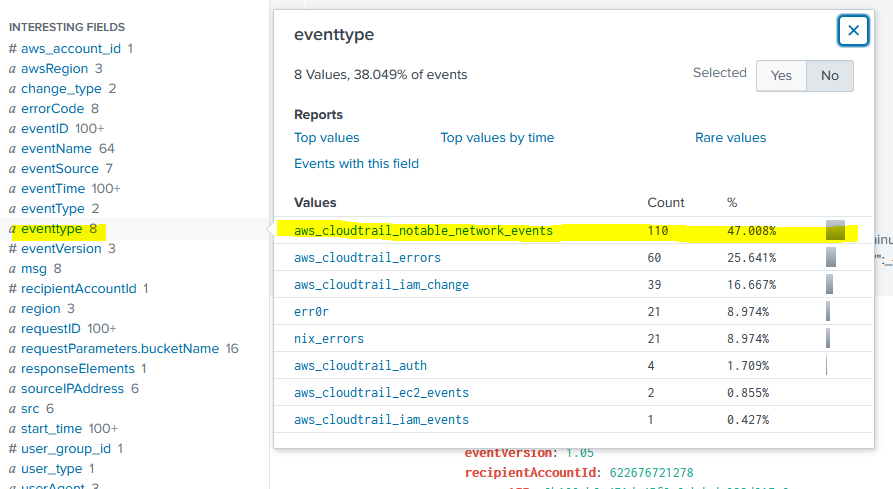
By clicking that field value, we’ll add it to our existing SPL and re-run the search. You can see that we’ll limit our logs from 615 to 110. But we can keep narrowing the scope of our logs by using more fields. Remember that the question is specifically asking for S3 activity. By leveraging the eventSource field, we can look at only logs sourcing from s3.amazonaws.com. Now we’ll be down to 57 logs, which is WAY more manageable.
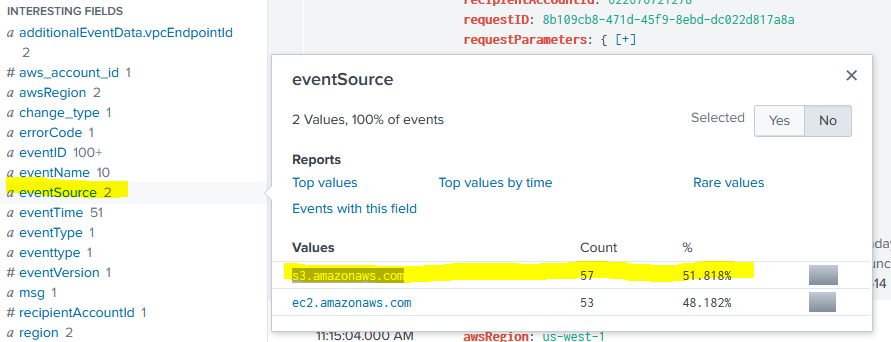
Now that we’re down to a relatively small pool of logs, we can use the eventName field to see all the notable network related API calls made by user “bstoll” on S3 resources (see how we methodically can craft SPL to find exactly what we want even without known the names of API calls). Here we can see there are only two API calls made, and one is PutBucketAcl which is setting an ACL (can google these API functions to see what they do) and now we’ll narrow our logs down to 2 all the way from 615.
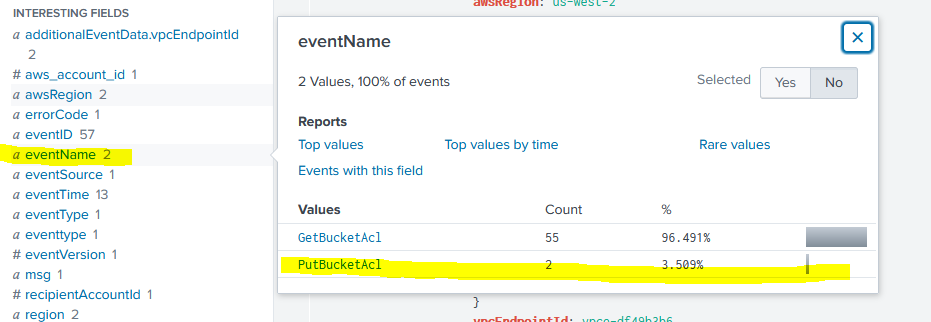
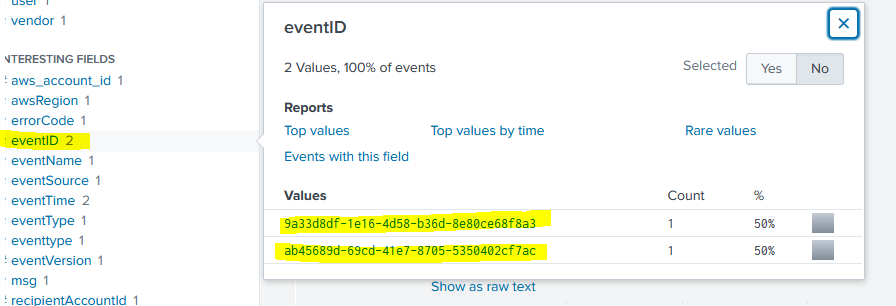
The answer to the question is now just the values of eventID:
Question 6
What is the name of the S3 bucket that was made publicly accessible?
This is a quick one, since we already have the logs in front of us, we just need to look for references to “bucket” and see there’s a field named requestParameters.bucketName with our answer:

Question 7
What is the name of the text file that was successfully uploaded into the S3 bucket while it was publicly accessible? Answer guidance: Provide just the file name and extension, not the full path. (Example: filename.docx instead of /mylogs/web/filename.docx)
We know the bucket name:frothlywebcode, we know the time range to search on (after the PutBucketAcl API call), and we know we’re looking for a text file. To simulate an actual IR scenarior, we’re going to again want to narrow the scope of our searching (enterprise AWS environments will have millions of logs to sift through even for a single day). We know that the PutBucketAcl API call happened at 13:01:46 UTC on 8/20/18, so we’ll look from there to an hour later. CloudTrail isn’t going to log the upload so we’ll need to look at other log sources.
By running | metasearch index=botsv3 sourcetype=aws* | stats values(sourcetype) as sourcetypes we can see a sourcetype referencing s3, so let’s try limiting searches to that one for now:
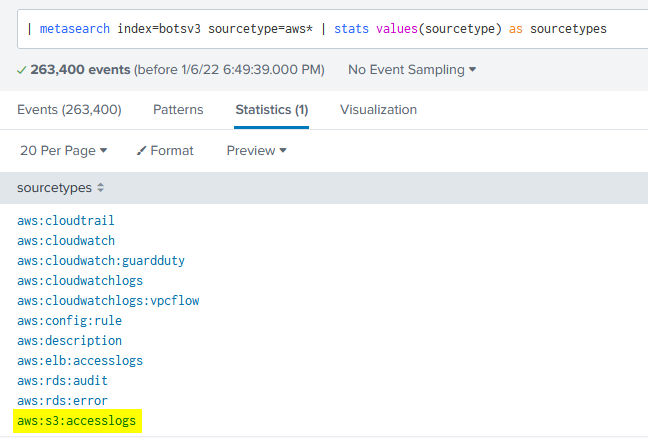

I had a really good feeling about this log source because I see HTTP request methods. So, we can assume an upload would show up as a PUT request, so let’s keyword search on that:

Question 8
What is the size (in megabytes) of the .tar.gz file that was successfully uploaded into the S3 bucket while it was publicly accessible? Answer guidance: Round to two decimal places without the unit of measure. Use 1024 for the byte conversion. Use a period (not a comma) as the radix character.
This is another quick one because the query we ran for PUT events also has this file in the event list.
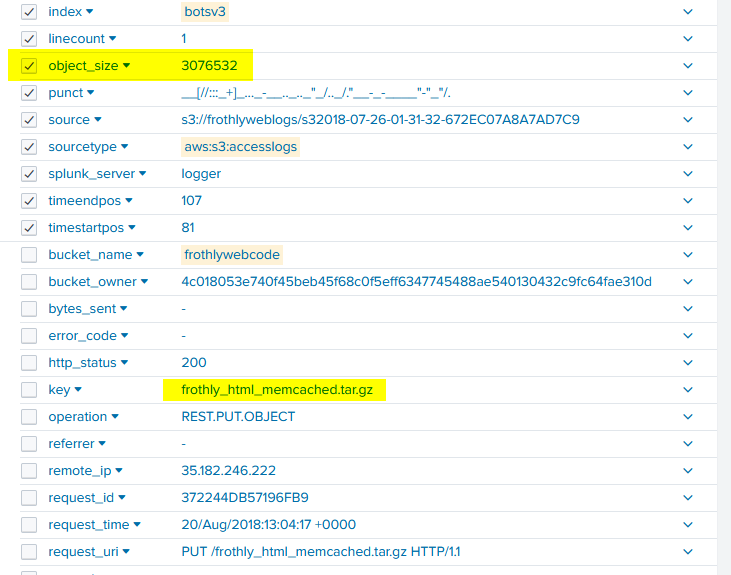
Now… the question wants the answer in megabytes, but this log is formatted in bytes. We could google the conversion OR in the spirit of learning more Splunk functionality, we can convert it directly through some SPL! To do that, we’ll need to utilze the field name object_size. We’ll use the fact that 1 MB = 2^20 Bytes.. or more simply: megabytes = (bytes/1024)/1024. We’ll use eval to make a new column with the conversion and create a pretty table that a client could potentially turn into a dashboard if they want to easily see all uploaded files.

Cryptomining
Question 9
A Frothly endpoint exhibits signs of coin mining activity. What is the name of the first process to reach 100 percent CPU processor utilization time from this activity on this endpoint? Answer guidance: Include any special characters/punctuation.
At first glance it doesn’t look like this question gives us much to go off on. However, let’s break this down:
- we know it’s asking about an endpoint
- we know we’re looking for a value of 100 in some field
- we know the field is going to likely relate to CPU or process information.
- we know this value is going to be correlated to a field about time or utilization
With all that, we can began metasearching for terms in the botsv3 index. I’m going to start by looking for any log source that references a “time” field (| metasearch index=botsv3 TERM(*time*) | table sourcetype | dedup sourcetype). Immediately, a few log sources should pop out:
- XmlWinEventLog:Microsoft-Windows-Sysmon/Operational
- syslog
- osquery
- PerfmonMk:Process
- top
- ps
I know top in Linux shows resource utilization and ps is another Linux process related command, but this question is asking about endpoints… and I’m going to make the bold assumption that users at Frothly aren’t running Linux workstations. So I’m going to focus on osquery and this PerfmonMk:Process log source.
If we limit our search to these log sources, then utilize “All Fields” to see what field names are parsed we see some useful info. There’s actually a field in one of these log sources called process_cpu_used_percent, and expanding that field out we can see a value of 100 parsed. So ’lets search on this field name to see what log source it actually comes from:
The question is asking for the first process to reach 100% utilization time. We can add | sort + _time to our query to sort the payloads in ascending order by the _time field. Why this field? Because in Splunk, _time will always be a parsed field name - one that represents the UNIX time of when a payload was processed by Splunk. The smallest epoch is going to be (in theory) the oldest event ingested.
8/20/18
9:36:26.000 AM

MicrosoftEdgeCP#2	100	100	56.73237371222325	2238772346880	2238621847552	28968.135501050394	386060288	329891840	248606720	227618816	227618816	37	8	118.253798	1620	792	1308800	143944	1420	50.21132817775018	65.91487105405851	116.1261992318087	1396.8151354627119	102342.48948905362	854507.3854112227	956849.8749002763	285641.9436789134	208818176
And with this, we have the answer!